I’ve never been great at estimating…I can admit it.
I remember my Dad asking typical Dad stuff like, “How many kids were at the dance?” and I would literally have no idea. Over the years, I have noticed this weakness in my math game and wondered a lot about what experiences are needed to feel good about estimating. How close is close enough? How important is estimating anyway? When do we need an exact answer and when will an estimate do? The other thing I have noticed is how satisfying it is when you can check and see how close your estimate is and how frustrating it can be without that verification.
In the Grade 8 Mathematics Curriculum used here in Nova Scotia, estimating and determining reasonableness of answers is part of everything we do. However, there is one outcome in particular that is focused on estimation: Find the approximate square root of a whole number that is not a perfect square. I’ve spent a lot of time trying to get this topic right. Maybe it’s because estimating has been a struggle for me personally or maybe it’s because I’ve seen this topic become calculator driven without a solid understanding first. In any case, my focus, as with all math topics, is to make this one very visual. We stick with models and manipulatives first to make sense of the concept. Knowing what I do about the satisfaction of verifying the accuracy of estimates, I design tasks that allow students different ways to test.
At the start of the year, students spend a lot of time investigating squares. We break out the square tiles to find what numbers can be represented as a square area. We discuss terms like perfect square and square root and label pictures to match our concrete models. We look for patterns in multiplication charts, and patterns in the differences between consecutive perfect squares. We notice common traits in terms of numbers of factors and how the prime factorization might look for a perfect square compared to other numbers. We dive deep.
With that base of knowledge firmly in place, we are ready to find the square roots of numbers that are not perfect squares. My first investigation is to find the square root of 18. I chose 18 intentionally. It is a number that is manageable with manipulatives and is not bang in the middle of two perfect squares. (This avoids the knee jerk 4.5 response.)
I ask students, “What is the square root of 18?”
Over the years this opening question has taken on a number of formats based on the students in front of me. I could choose to facilitate a whole class discussion with a chatty, comfortable bunch. In some classes, I have suggested that we think on our own for a minute then turn and talk to a partner before we share out as a class. These days I might send random groups of three to a vertical non-permanent surface to see what they can think through together. After many years of asking this question, I always have the same responses:
“There is no square root – 18 is not a perfect square!”
“Well…there has to be a square root – it’s just not a whole number.”
Then “Ohhhhhhhh!”
(more scribbles and chatting…)
“It has to be between 4 and 5!”
Me: Why?
Then with their picture or square tiles, students show me their 4 by 4 square with 2 squares left over.
Me: So how can we get those two into the picture?
At this point, someone usually suggests that the other two tiles could be spread on the length and width. (More “Ohhhhhhh!” and chatter and scrambling) One student usually tries to be “super helpful” and break apart, bust up, or tear my square tiles to make the model while I stand lamenting out loud, “It’s too bad we didn’t have a better manipulative for this….squares we could just rip”. At this point I am usually holding a stack of square post-it notes, absentmindedly flipping through them as I search for the answer to this problem…heehee. The students clue in, come grab some post-its and the investigation continues.

Here we see the largest perfect square we can create with 18 post-its – 16, represented in a 4 by 4 grid. We have 2 post-its left…what should we do? Students figure out what to do with the extras.
They break up the squares so they can be evenly distributed on the length and width.
Me: “Why should we spread these equal pieces on both the length and the width?”
Students: “So it stays a square!”

Some students spread the pieces around the whole square, or cut up the post-its randomly and not equally. Let them. They will discover on their own what methods work best and make adjustments as they go. Lastly we check out our models. We know from our work with perfect squares that the side length is the square root. What is our new side length? How can we tell? Label it. Is this a good estimate? Convince me! How can we tell from our picture that this is an estimate and not an exact answer?

I love this investigation. I see a lot of light bulbs turning on as we work. I am mindful too that students don’t have the same comfort, ease, and experience with scissors and glue that students their age used to have, so we pair up if we need to and really take our time.
When we are finished with this example I ask if this method of modeling would work every time for every number. And “…how many more examples do we need to do before we are comfortable estimating with models?” At this point I’ve also been known to exclaim, “Man…if we have to do this every time we estimate square roots, I am going to need to buy a lot more post-it notes!” Some students look at my stacks of post-it notes (I do have a lot! I use them for everything!) and say we should be good for a bit, while others tell me they could probably draw it without using post-its or even picture the model in their head and get an estimate. They often recognize and point out the limitations of the manipulative, knowing that larger numbers would present a problem. Yasssssssss! Students are then directed to choose some square roots to find. I may suggest some numbers like 20 and 13 so we see some different fractions but leave it up to students to decide what they need to do to feel confident with this method. Some use post-its, some sketch, some picture their answer and write a description – all good! I like them to test by squaring their estimate to see if their solution is valid and we consolidate by sharing what we have learned. Sometimes we just talk about the examples we tried, while other times students may be ready to talk in general terms. With some confident learners I might further nudge with, “How could we be sure of the fractional portion of our estimate without drawing or constructing a model?” Some students note that the numerator is the number of leftover squares while the denominator is the number of spots they need to be spread along or the sum of the length and width. Others won’t make that connection yet but we try lots more examples to test theories.
In the days that follow, we might do a few more typical things like using number lines for estimating and using systematic trials to get closer and closer to an answer while discussing that an exact answer may be out of reach.
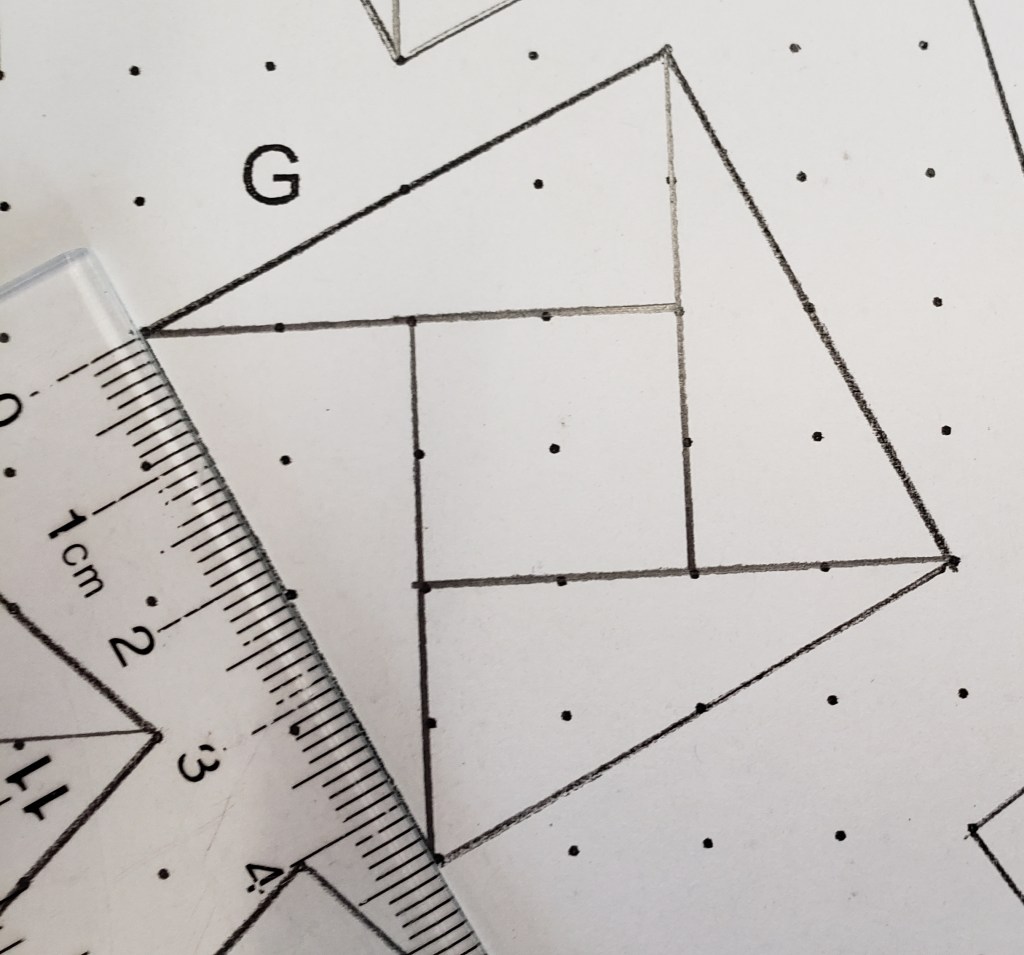
Another favorite activity to guide students in confirming their estimates is the one I do with tilted squares. For this you will need 1 cm square dot paper. I use this link. When you print it, confirm with a ruler that it is in fact 1 cm dot paper. Otherwise the lesson will not work.
I start by asking students to pick a perfect square under 25 and draw it. We discuss again that the perfect square is seen in the area and the square root is the length of the side. We use our rulers to confirm what we already know. Next I remind students that we are estimating square roots of non-perfect squares, so we should probably draw some of them…can we? Let’s draw a square with an area of 8 square centimeters. I say, “Be exact! We want to be able to check our estimates by measuring like we did with our first example!” Students usually try their luck drawing squares with the same orientation. To their credit, they try drawing squares with side measures just under 3 cm (yay!) but say that it won’t be exact or it is impossible to be exact if the number is not a perfect square. That’s when I blow their minds with my picture…

What area does this model represent? 8?!? What?!? How can that be? 8 isn’t a perfect square!?!
How can we confirm the area is 8? Here a student will come up and box out or count up the squares for the students that don’t see it yet. They show that partial squares can be combined to have an exact total area of 8 square centimeters. Can we estimate the square root of 8? How could we use our model to check our estimate?

I love how simple this is. I love how concrete this is. I love how the looks on student faces go from perplexed to curious to confident. I often do not have to prompt students to try other tilted squares – they just do. Students can estimate the square root of their number in any way that makes sense to them, then put a ruler on the side length of their square and see how good their estimate actually is. I love that the immediate feedback they receive comes from their own measuring. No need to always resort to a calculator for “the correct answer”. I also love the added challenge of drawing titled squares and confirming their areas. What other squares can we draw? Are there numbers that can’t be drawn? Great estimating practice (which we need for this outcome) with a different spin. Try it!


I have used this presentation to consolidate both activities after the fact . I find a digital version especially useful for those students whose lack of precision may have impacted their understanding. These lessons are, of course, just two within a bigger picture that focuses on problem solving using estimating square roots in context. We figure out the best fencing prices for yards, determine what square rugs fit in what rooms, and all sorts of other scenarios. But wherever our work with estimating square roots takes us, these two investigations are the ones that I make sure to include. So what’s the appeal?
In the case of the post-its, perhaps the appeal is the concrete nature of the model – so obviously an estimate with that missing corner piece. Maybe it’s the chance to use fractions as the more obvious choice for side measure instead of the regular decimal default.
The draw of the tilted squares is its simplicity. And of course the chance to do some measuring. The idea that your own measuring provides the immediate feedback on your estimating skills – well that is just pure gold.
Lastly, I love how satisfied and confident students are after these tasks. They can often explain, show and verify and are willing to create their own tests to discuss with their peers. It’s one of my favorite examples of the Play…Persist…Prove ideal that I try to bring to each and every math class. Students are completely in the driver’s seat, challenging each other to draw a certain square area or seeing who can get the closest estimate. During these moments I often ask, “Are we there yet?” to see how students feel about their estimate. With these activities students often reply with confidence, “This is as close as it gets!”

How do the concrete and visual strategies (like using post-it tiles or tilted squares) help students understand and verify their estimations of square roots? Greeting : <a href=”https://dsm.telkomuniversity.ac.id/blogs/”>Multimedia</a>
LikeLike
Thank you for your comment.
Once students have made an estimate, they can check to see how close they get by actually measuring the side length of the titled square with an area of 8, since the side measure of a square area is the square root. With the post-it notes, if the length of one post-it note is equal to 1, you can determine the side measures of the almost square that you create. This visual is especially good at driving home the idea that this is an estimate and not an exact answer. Proving by squaring estimate will provide further verification.
LikeLike